


Events
& Workshops
Back to Blue will be participating in
Other Ocean Events
Back to Blue will be participating in
the
following events:
 World Ocean Summit & Expo
2025
World Ocean Summit & Expo
2025 UNOC
UNOC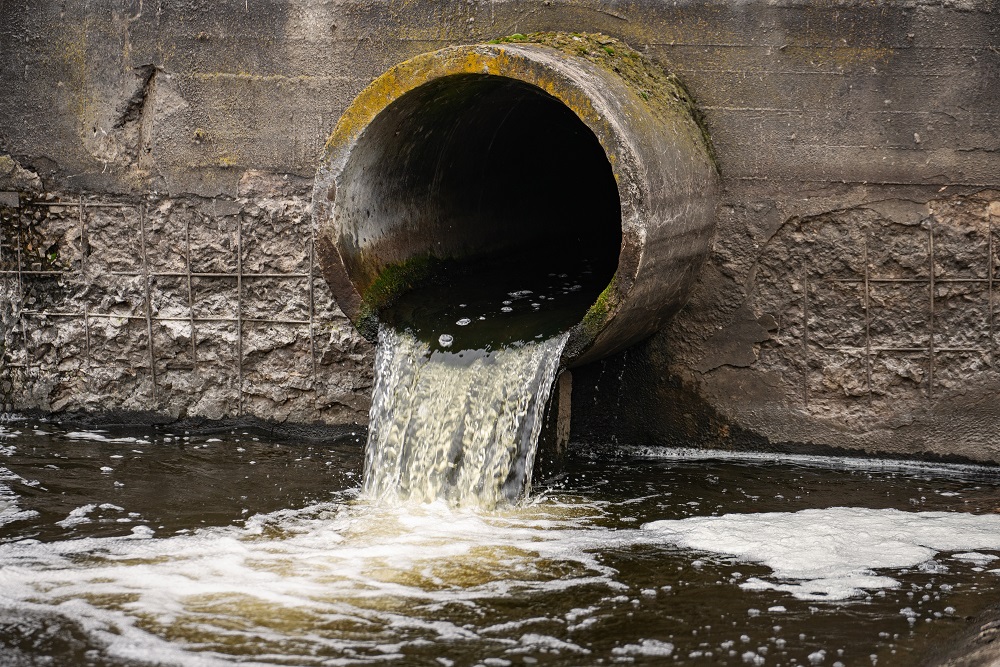 Sewage and wastewater pollution 101
 Slowing
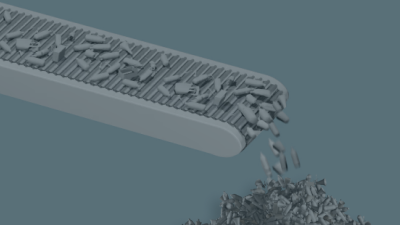
the chemical tide: safeguarding human and ocean health amid
chemical pollution
Slowing
the chemical tide: safeguarding human and ocean health amid
chemical pollution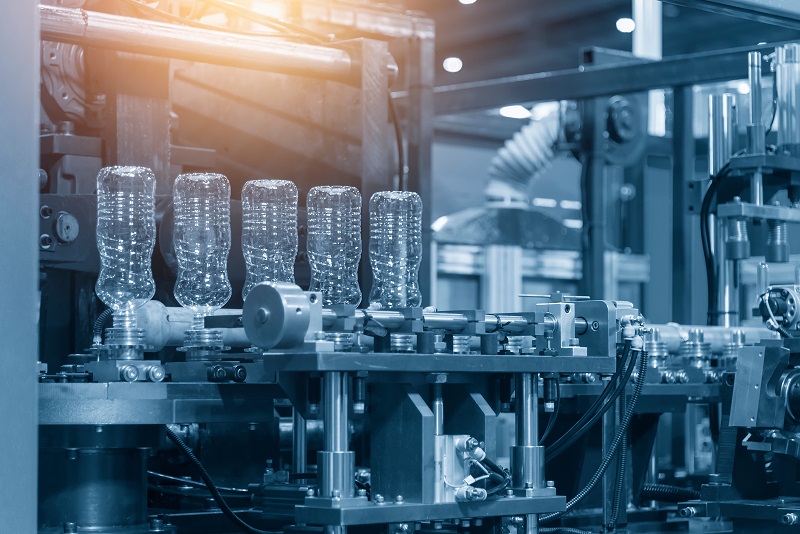 Hazardous chemicals in plastics - the discussions at INC


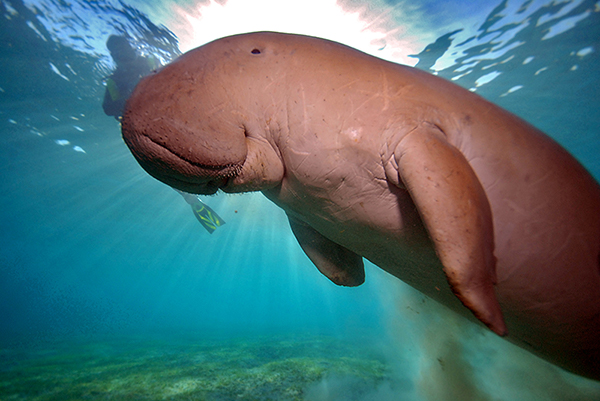 What if the world wakes up to the threat of marine chemical pollution?" class="" data-popup-title='