Only bold and sweeping reforms will bend the plastic consumption curve. Achieving a reduction in plastic pollution will require all stakeholders–from the petrochemical companies to the consumers–to control the crisis. A piecemeal approach won’t work.


The world will continue to drown in plastic waste unless a bold and comprehensive set of policy changes are agreed by the UN. To bring about peak plastic consumption, these policies would need to be at the most ambitious end of the spectrum being debated by UN treaty negotiators, which include governments, the petrochemical and consumer goods industries, and environmental groups. This is according to research by Back to Blue, an initiative of Economist Impact and the Nippon Foundation, which models the impact of a selection of policies being considered by world leaders as they draft a legally binding treaty to stem plastic pollution.
We model the impact of: a phased ban on problematic, unnecessary single-use plastic products (SUPPs); a mandatory extended producer responsibility (EPR) regime imposed on brands and retailers that introduce packaging to the market; and a tax on the production of virgin resin designed to redistribute the cost of negative environmental externalities. Our model tests whether any of these, alone or together, can achieve peak plastic consumption before 2050. The analysis is focused on the 19 countries of the G20.
Combined, the policies slow plastic consumption growth, but will not be enough to bring about a peak in plastic consumption by 2050, illustrating the scale of the challenge that lies ahead.
If the negotiators fail to agree on any policy interventions, we project that plastic consumption in the studied G20 countries will nearly double by mid-century.

1
The majority (99%) of plastic is derived from oil. The majority of plastic resin is produced in North America and Western Europe. China produces nearly a third.

2
Plastic converters modify or combine virgin or recycled materials to manufacture plastic products ranging from carrier bags to car interiors, toothbrushes to drainpipes.

3
Retailers and consumers use under half (45%) of all manufactured plastic in packaging with building and construction using around 19%.

4
Less than 10% of plastic waste generated has been recycled; 14% incinerated and 76% disposed of in landfills or released into the environment. Large amounts of plastic waste are exported with the majority being sent to countries with limited waste management capacities.


None of the three interventions we modelled will bring about peak plastic consumption by 2050. An integrated approach combining all three makes a dent—growth of 1.25 times the 2019 figure, compared with the baseline forecast of 1.73 times.
A globally agreed ban on single-use plastic products will do more to curb plastic consumption growth than a mandatory EPR and a tax on virgin resin. Under the SUPP ban, plastic consumption in 2050 is 1.48 times the 2019 figure.
EPR policies will require industry players that introduce packaging to the market to cover the cost of collecting and processing it after use. By 2050, consumption will grow to 1.66 times the 2019 figure. EPR is nonetheless vital, as it will improve waste collection and increase recycling rates, which will curtail plastic leakage into the environment.
An environmental tax would raise the cost on the principal input–virgin resin–helping to redress the existing anomaly of plastic prices that do not fully reflect its true cost to society. Our modelling suggests the impact of such a tax on consumption growth will be limited: consumption in 2050 is likely to be 1.57 times the 2019 figure, not much lower than the 1.73-times growth in our baseline forecast.
234M
Tonnes
2000
460M
Tonnes
2019
765M
Tonnes
2040
1230M
Tonnes
2060
million tonnes


empire state buildings
million tonnes
empire state buildings
Source: OECD Global Plastics Outlook Database
Between 2000 and 2019, global plastic waste generated rose from 156 million tonnes to 353 million tonnes, a 126% growth rate. Assuming the UN treaty spurs dedicated action among national governments to combat plastic waste generation, this rate of growth is likely to slow down to 74% by 2040.
Source: OECD Global Plastics Outlook Database
156.2million tonnes


With the notable exception of the EU, attempts to regulate parts of the plastic lifecycle have been left mainly to national or subnational authorities. Country-level initiatives are too fragmented, however, to generate a significant global impact.
Many governments at national, regional and municipal level have put rules in place on the sale or use of plastics that organisations or individuals must comply with. But many potentially impactful programmes are non‑mandatory.
It was once thought that recycling was the answer to plastic pollution. But as OECD recycling data confirms, current efforts are not making a big enough impact to dent plastic pollution, much less to support plastic circularity.
14million tonnes


By 2050, plastic consumption is expected to almost double without any policy interventions (see baseline series in the chart below). Even with all the selected policy interventions, consumption growth is expected to slow down, but will still be at least 1.25 times the 2019 consumption levels.
A phased ban on single-use plastic products (SUPP)
A mandatory EPR scheme imposed on retailers and brands
Plastic tax on virgin resin production
The application of each scenario is based on certain assumptions and the outcomes pose some challenges. Below, we discuss each scenario in detail.


We use ban rates already in place in some countries. For those that do not have bans, we assume the global plastics treaty will make such bans mandatory, beginning from 2025. We assume that the ban rates will begin between 0.5% – 1% of the existing volume of plastic waste for most countries.
We expect countries to continue widening the scope of their bans to include more products. We quantify this in the model by adding a 10% increment to the previous year’s ban rate every year, across all countries.
To understand the effects of the policy interventions, we compare future plastic consumption levels with consumption levels in the base year of 2019. Under the baseline scenario without any policy interventions, we expect plastic consumption in 2050 to be 451mt, nearly two times higher than in 2019. In the case of a staged ban on single-use plastic products, 2050 consumption will be 14% lower than the baseline, at 385mt. This is a slower rate of growth, but still 1.48 times the 2019 figure in 2050.
To make a significant dent in the growth of plastic consumption, the bans on single-use plastic products imposed by countries must be considerably more aggressive than those considered here. This can be achieved without unduly limiting the production of plastic products that are necessary, such as those used for medical or for food hygiene purposes. But there are unnecessary and plastic items that are not yet being considered as part of country bans, including extremely hazardous ones such as fishing nets.


South Korea
France
UK
Australia
Germany
China
Canada
India
Japan
Italy
South Korea
France
UK
Australia
Germany
China
Canada
India
Japan
Italy
USA
Saudi Arabia
Indonesia
Turkey
Russia
Brazil
South Africa
Mexico
Argentina
*Please note that the above is not an exhaustive list of global SUPP ban status. In this research, we have only covered the 19 countries in the G20 group.


All businesses are responsible for collection and sorting of post-consumer discarded packaging that they placed on the market and sending it for recycling.
Though ambitious, we still assume that enforcement of EPR regulations will be strictly enforced by governments and regulations to monitor compliance by businesses.
We assume the costs of collecting, sorting and recycling are going to be passed on to the retail consumers, which will lead to an increase in retail prices of various consumer products.
A univariate regression is used to calculate the price elasticity for each country and for each polymer category. Elasticity reflects the sensitivity of demand to price changes. We assume an average 2% increase in polymer prices for retail consumers.
With a global mandate to implement EPR, plastic consumption grows at a slower rate over the forecast period than in the baseline scenario of no policy interventions. The impact is marginal in the initial years of the mandate (we assume its implementation begins in 2025) but grows the longer EPR is in place. By 2050, worldwide plastic consumption under the EPR scenario rises to 434mt, which is 1.66 times the 2019 figure. This compares with baseline forecast growth that is 1.73 times the 2019 figure.
However, the EPR impact on consumption growth will be more limited over the long run than that achieved by either a ban on single-use plastic products or a plastic tax. At the assumed rate of price increase, there will be no plateau in polymer consumption by the middle of this century.
While the result of this scenario is less encouraging than the others, a mandatory EPR policy will make producers, retailers and brands responsible for the end-of-life of the products they put on the market. This should improve recyclability of plastic products by motivating industrial consumers to use packaging that is easy to collect, sort and recycle.
Effective recycling is integral to any effort to reduce plastic pollution and support circularity. Governments and industry groups have been actively supporting recycling since the 1980s yet, less than one-tenth of the plastic that has been produced has been recycled. There are several reasons for this, foremost among which is cost.
The rest is either incinerated, mismanaged or littered.
Source: OECD Global Plastics Outlook Database
Recycled
Incinerated
Mismanaged
Landfilled


We assume plastics to have a global warming potential of between 1.7kg and 3.5kg of CO2, depending on the type of plastic. For every kilogram of fossil-fuel based plastic produced, anywhere between 1.7 and 3.5 kilograms of carbon dioxide is released.
The effective carbon rate is a combination of three components: emission permit price, carbon tax and fuel excise tax. The inclusion of each of these components incentivises the use of lower carbon energy alternatives by making it costlier to use energy sources with a high carbon footprint.
A benchmark value in the form of a minimum carbon price for all energy related carbon emissions. Carbon prices may be set at or above this benchmark.
The increase in carbon taxes is absorbed by polymer prices, leading to virgin plastic getting costlier over time. We use elasticity to arrive at the final price increase in plastic prices.
The application of an effective tax reduces the growth of plastic consumption by mid-century compared with the baseline scenario, but it does not stem or reverse it, similar to the ban on single-use plastic products and mandatory EPR scenarios. By 2050, worldwide plastic consumption with the application of a carbon tax rises to 409mt, which is 1.57 times the 2019 figure, compared with baseline forecast growth of 1.73 times.
Taxes upstream would have more of an impact on plastic consumption growth in the G20 countries than an EPR mandate but less than a ban on single-use plastic products. It is likely that a suite of taxes is needed to drive the response that is needed from producers and consumers.
£200 ($247.42) per tonne on plastic packaging components
€0.45 ($0.49) per kilogramme of plastic for single-use items
A mandatory fee of ¥3-5 ($0.03-$0.05) for each plastic bag
Excise tax of Rp450-500 ($0.03) per plastic bag, to be fully implemented

Many countries tax plastic at one or another stage of its lifecycle. Most such taxes are levied downstream. According to the UNEP, 27 countries had introduced taxes on the manufacture or import of plastic bags as of 2018, and 30 countries levied a point-of-sale fee on consumers for their use.
In Spain, a tax is levied on manufacturers and importers of plastic packaging and on volume (€0.45 per kg of packaging). A similar tax (with the same rate) is scheduled to come into force in Italy in 2024.
An analogous tax in force in the UK since April 2022 differs from the above examples in that it covers packaging or finished products in which recycled plastic does not exceed 30% of the item’s total plastic content.
We have examined the potential impact of the three policy measures separately, but the future plastics treaty will ideally call for the implementation of multiple measures.
In our analysis, combining a ban on single-use plastic products with an EPR mandate and a production tax will certainly do more to flatten the consumption growth curve in the G20 countries than any of these measures in isolation.
But the impact of this integrated approach is disappointingly limited: 2050 consumption of 325mt is still 1.25 times higher than in 2019.
|
Year |
Baseline |
S1 |
S2 |
S3 |
Integrated approach |
|---|---|---|---|---|---|
|
0 |
0 |
0 |
0 |
0 |
0 |
|
0 |
0 |
0 |
0 |
0 |
0 |
|
0 |
0 |
0 |
0 |
0 |
0 |
|
0 |
0 |
0 |
0 |
0 |
0 |
1.73
1.73 times the 2019 consumption levels if no policy interventions are implemented
1.66
1.66 times the 2019 consumption levels if only an EPR scheme is implemented
1.57
1.57 times the 2019 consumption levels with a tax on plastic production
1.48
1.48 times the 2019 consumption levels under the ban of SUPPs
1.25
1.25 times when all three policy measures are implemented. Lower than the baseline, but still rising.
1.73
1.66
1.57
1.48
1.25
1.73 times the 2019 consumption levels if no policy interventions are implemented
1.66 times the 2019 consumption levels if only an EPR scheme is implemented
1.57 times the 2019 consumption levels with a tax on plastic production
1.48 times the 2019 consumption levels under the ban of SUPPs
1.25 times when all three policy measures are implemented. Lower than the baseline, but still rising.
Clearly, to reverse plastic consumption growth by mid-century, the plastics treaty will need to stipulate more stringent measures and conditions than we have factored into our model. For example, the phasing of bans on single-use plastic products in countries will likely need to be faster and on a steeper trajectory than we’ve assumed. And a tax on virgin feedstock—that is, derived from fossil fuels—in the upstream production of plastic will also need to be higher.
Implicit in our scenario analysis is that bans and limits to plastic demand growth due to higher retail prices will motivate industry to push harder on technological innovation. Such innovation must, for example, bring about the redesign of packaging and products that contain little or no plastic. The capabilities of sorting and recycling technologies must also advance to ensure that all recyclable plastic is actually recycled.
No one should underestimate the opposition that such measures are likely to encounter from some producers, retailers, industry bodies, consumer groups or other actors, even if the world’s major stakeholders have signed on to them.
This makes it all the more important that the treaty also addresses monitoring and enforcement. Experience suggests that potential loopholes that would undercut the achievement of targets are numerous. For example, EPR schemes—particularly in low-income countries—will need to be closely monitored at city and regional levels. Fines imposed on producers, industrial consumers or retailers will need to be stiff enough to enforce compliance, and must be enacted at the highest government level possible.
The chances of failure—not just that no treaty emerges but that one which does is too weak to reverse the plastic tide—are considerable. The negotiators must nevertheless succeed, as there may never be as much goodwill as there exists now among the different stakeholders to achieve a breakthrough.


The data visualisation tool allows the user to experiment with differing levers in the above-mentioned scenarios to test if a peak in consumption can be achieved by choosing a more aggressive ban/tax rate. We have modelled the output under three assumptions for each scenario: a minimum rate, an intermediate rate and a maximum rate.
A minimum rate assumes that the treaty is able to enforce the bare minimum level of efforts needed to be implemented by countries. An intermediate rate assumes that countries actively work to choose higher ban rates and tax rates. A maximum rate allows the user to select the most aggressive rates of bans and taxes that are currently feasible.
The user can choose what level of ban/tax rate they would like to see for each scenario. Based on the selection of these scenario levers, the model will generate a new set of results. These results are available to be downloaded into a data workbook.
Baseline
SCENARIO 1
A phased ban on single-use plastic products (SUPP)
SCENARIO 2
A mandatory EPR scheme policy imposed on consumers
SCENARIO 3
Plastic taxes on virgin resin production
ALL SCENARIOS
Select Country
In March 2022, the United Nations Environment Assembly in Nairobi adopted resolution 5/14 “End plastic pollution: towards an internationally legally binding instrument.” This resolution endorses the creation of an internationally legally binding agreement by 2024 and focuses on the complete life cycle of plastic, including design, production and disposal. The treaty negotiations began in November 2022 and are expected to stage a debate on the range of policy options that can be adopted to address plastic pollution.
In tandem with the ongoing treaty negotiations, the ‘Peak Plastics’ workstream under the Back to Blue initiative, has been developing an evidence-based approach to form an understanding of the extent to which selected policy measures can bend the plastic consumption curve that will help to reduce plastic pollution.
We adopt a scenario analysis approach testing the effectiveness of three possible policy options to prevent future plastic pollution The selection of the three scenarios under consideration reflects the lifecycle approach to tackling the plastic crisis. The key underlying assumption in all these scenarios is that compliance with these policies is mandatory for all industry participants. The countries in scope are the 19 countries of the G20. This selection was made as these 19 countries account for almost 78% of global GDP.
For the full technical methodology, please download the methodology note.

You can change scenario options in order to see how the peak consumption changes accordingly.
videos
A podcast series, led by Charles Goddard and Naka Kondo at Economist Impact, talks to leading experts around the world about the science of chemical pollution in the oceans - and the most promising pathways to tackle the scourge.
With less than ten years to achieve the 2030 Sustainable Development Goals, there is a renewed urgency to examine global systems and balance human aspirations with the planet’s ability to sustain them. This is why Economist Impact has launched The Sustainability Project, a content platform and community hub combining insights, innovation and influence. Our aim is to convene and engage global stakeholders who have the power to bring real change.
Economist Impact’s World Ocean Initiative imagines an ocean in robust health, and with a vital economy. Year-round and at our flagship World Ocean Summit, we foster a global conversation on the greatest challenges facing the seas, inspiring bold thinking, new partnerships and the most effective action to build a sustainable ocean economy.
We welcome your feedback and comments.
If you have an editorial or media related request, a member of the media team will get back to you.
Back to Blue explores evidence-based approaches and solutions to the pressing issues faced by the ocean, to restoring ocean health and promoting sustainability. Sign up to our monthly Back to Blue newsletter to keep updated with the latest news, research and events from Back to Blue and Economist Impact.
The Economist Group is a global organisation and operates a strict privacy policy around the world.
Please see our privacy policy here.
Thank you for your interest in Back to Blue, please feel free to explore our content.
If you would like to co-design the Back to Blue roadmap or have feedback on content, events, editorial or media-related feedback, please fill out the form below. Thank you.
The Economist Group is a global organisation and operates a strict privacy policy around the world.
Please see our privacy policy here.


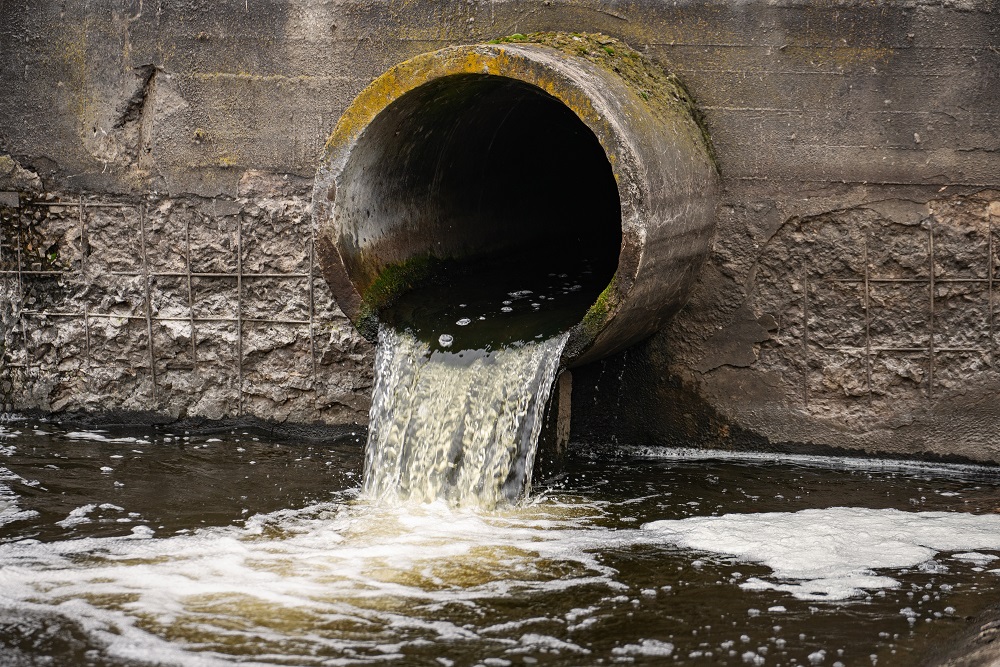 The scourge of untreated wastewater
 Slowing
the chemical tide: safeguarding human and ocean health amid
chemical pollution
Slowing
the chemical tide: safeguarding human and ocean health amid
chemical pollution Hazardous chemicals in plastics - the discussions at INC


 What if the world wakes up to the threat of marine chemical pollution?" class="" data-popup-title='